The question
Can advanced economies keep growing while cutting carbon emissions? And where emissions have fallen, is that genuine domestic change, or have they just been shifted offshore through global supply chains? Using OECD data from 2010 to 2020 for six developed economies, we built a Power BI report that brings economic, emissions and policy indicators together, moving from broad trends to a more careful judgement on how credible each country's decoupling really is.
How the report works
- Growth and emissions. Indexed line charts put GDP and emissions on the same footing across countries, with average summaries alongside. The trends move in opposite directions: growth and emissions cuts aren't mutually exclusive.
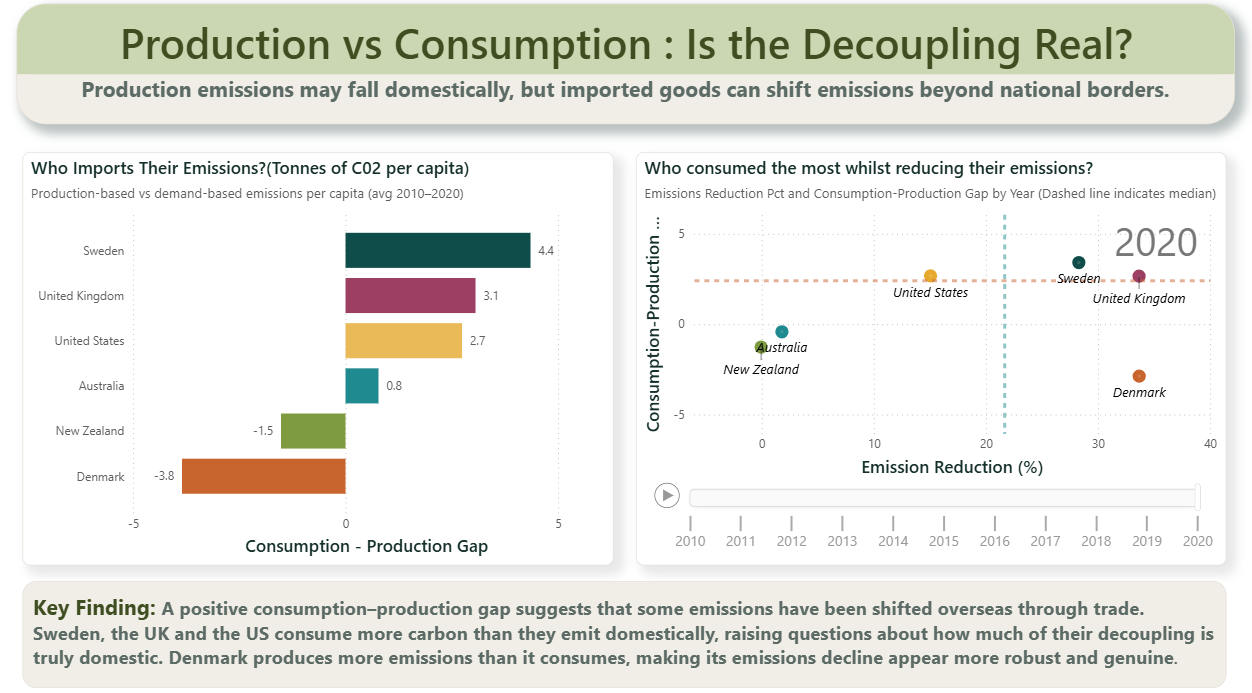
- Genuine or displaced? Comparing production-based and consumption-based emissions shows which countries actually cut their footprint and which shifted production overseas. Sweden, the UK and the US consume more carbon than they emit domestically, while Denmark produces more than it consumes, making its decline look more genuine. Decoupling becomes a spectrum rather than a yes or no.
- Do environmental taxes hurt growth? A bar chart of average environmental tax revenue (% of GDP) compares policy effort across countries, with a direct comparison of the highest- and lowest-taxing country.
- Trajectories over time. A dynamic scatterplot tracks emissions reductions against the consumption–production gap from 2010 to 2020, separating countries whose gap stayed stable from those leaning more on imported emissions.
What it shows
Growth alongside lower emissions is achievable, but how much of it reflects real domestic change depends on policy choices and structural factors that vary country to country.
That question matters more in 2026, when the EU’s Carbon Border Adjustment Mechanism (CBAM) moved into its definitive phase, putting a price on the carbon embedded in imports such as steel, cement and aluminium, the same offshored emissions this report tracks.
My role
This was a group project of three. I led the development of the Power BI report: selecting the dataset, cleaning and transforming the data, building the calculated measures and shaping the analytical framework behind the dashboard. We worked together on design decisions, interpreting the results and reviewing the final deliverables.