The brief
The assignment was to set our own business problem and solve it in Python, using data pulled from several different sources. We framed it around a New Zealand wealth-advisory desk that needs evidence before advising retail clients on cryptocurrency, broken into four questions a client might actually ask:
- Do major news events move the crypto market, and does the direction of the news predict the direction of the price?
- Held for the long run, does crypto settle into something that behaves like a traditional asset?
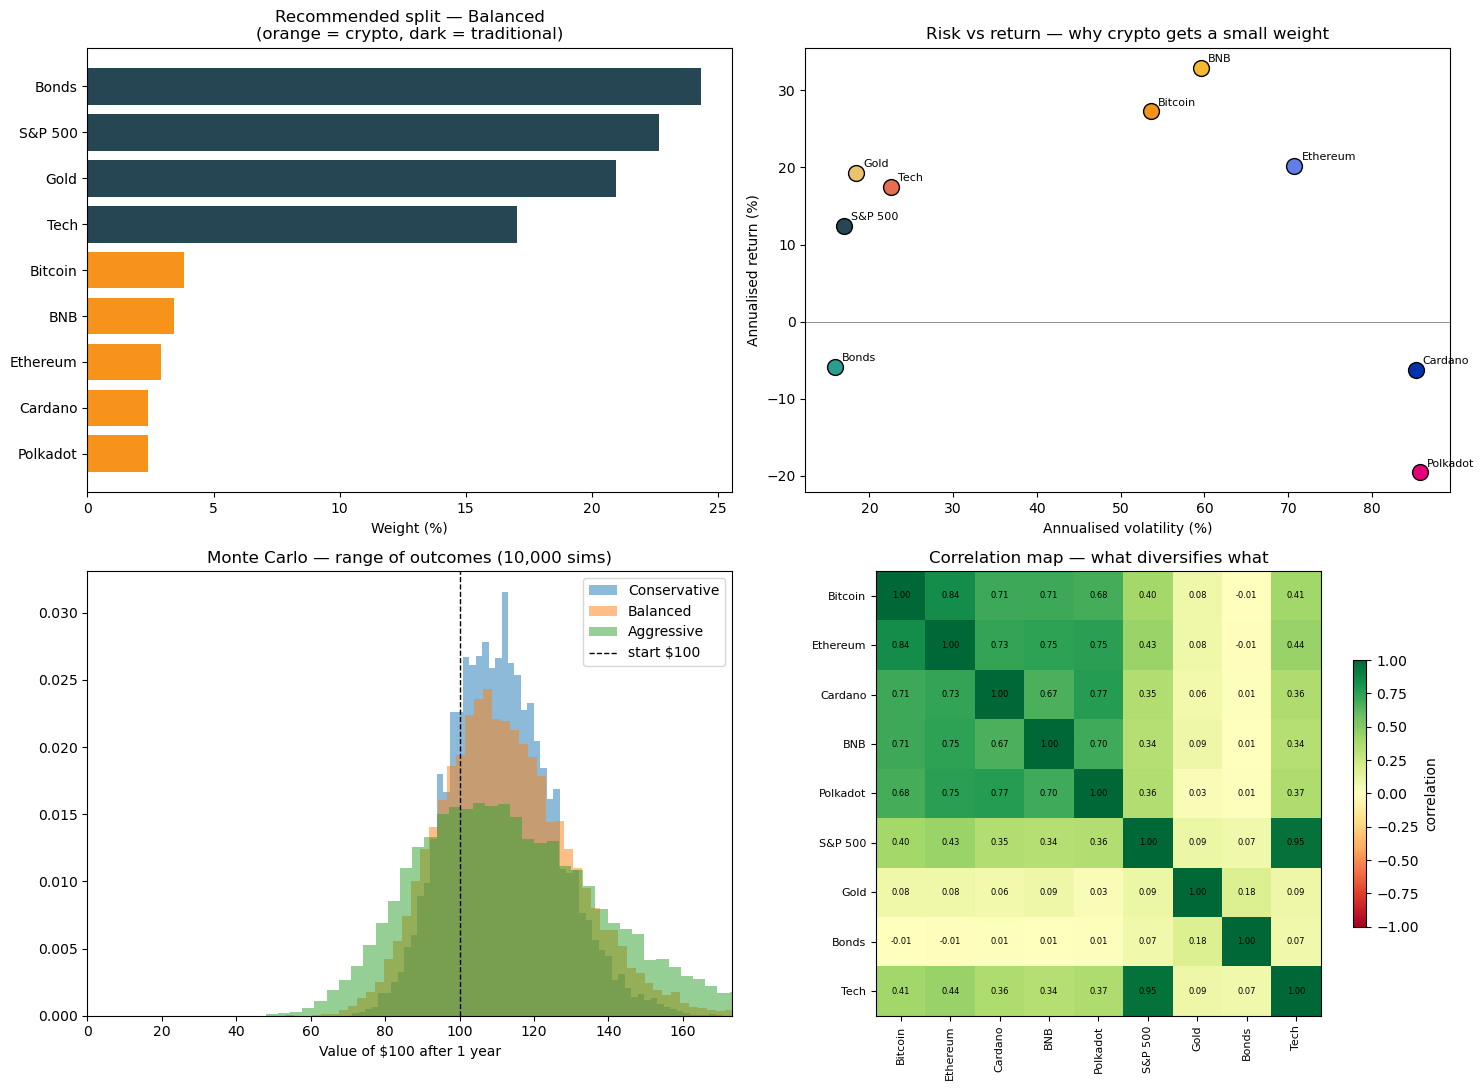
- On a fixed budget, how much crypto should a sensible investor hold, and how should it be split?
- What is the retail community's mood toward crypto right now?
Building the dataset
Five coins run through the whole study: Bitcoin, Ethereum, Cardano, BNB and Polkadot, the largest, longest-listed coins common to both price sources.
- Two sources, one timeline. A Kaggle archive (one CSV per coin) supplies the history from 2013 to mid-2021; the Yahoo Finance feed, pulled through the
yfinanceAPI, extends it to 2026 with split-adjusted closing prices. - Cleaning. Each coin file was trimmed to date, close, volume and market cap, stacked into one long table, and the dates converted and normalised so the same day lines up across coins.
- Audit. Checks for duplicate coin-date rows and zero or negative prices both came back clean. The coins list at different times, so the gaps before a coin launched were left empty rather than filled with invented numbers; each question only uses dates where its coins actually trade.
- Joining. Both sources were pivoted to a wide table and joined at a single hand-over date, 1 July 2021, to avoid double-counting days or carrying two prices for the same day.
- Returns and regimes. Prices were converted to daily returns, and each day tagged by market cycle (2017–18, 2020–21, 2024–26) so the cycles can be compared.
1. Do headlines move the market?
Method. An event study of 43 dated events from 2017 to 2026, across four types: celebrity, market, policy and geopolitical. Each event was tagged bullish, bearish or neutral from the news itself, before any prices were looked at, so the outcome couldn't be read back into the headline. For every event and coin we measured the five-day return, then tested whether the price moved the way the news implied more often than a coin flip (binomial test), and whether bullish news out-earned bearish news (Welch t-test).
Result. Events move prices a lot (the 2024 US election was followed by +16% for Bitcoin and +77% for Cardano in five days), but direction is close to unpredictable. No coin beat a coin flip at the 5% level:
| Coin | Hit rate | p-value |
|---|---|---|
| Bitcoin | 59% | 0.17 |
| Ethereum | 59% | 0.17 |
| Cardano | 52% | 0.44 |
| BNB | 56% | 0.35 |
| Polkadot | 39% | 0.92 |
By type, market news (59%) and celebrity news (59%) did best, policy news worst (45%), none significant. Bullish events averaged +2.35% and bearish −2.70%, but the gap wasn't significant (Welch t = 1.37, p = 0.18). Headlines aren't a trading signal a retail client can act on.
2. Is crypto maturing into a traditional asset?
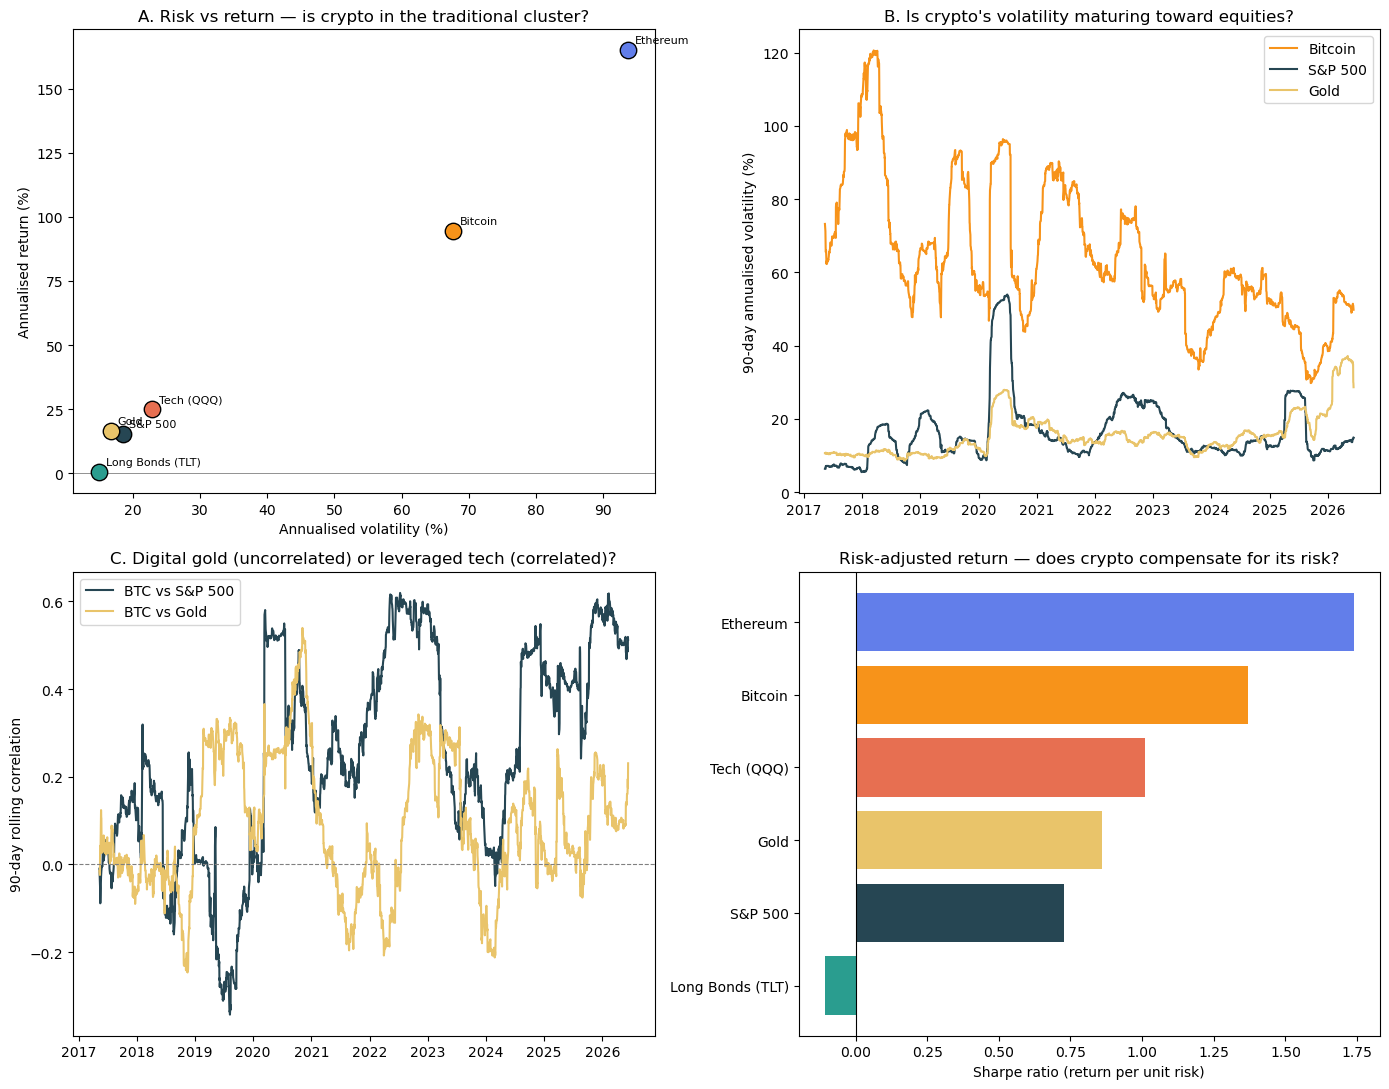
Method. Bitcoin and Ethereum against the S&P 500, gold, long-dated bonds (TLT) and the Nasdaq-100 (QQQ) on a shared trading calendar from 2017 to 2026, comparing annualised return, volatility, Sharpe ratio and maximum drawdown, plus 90-day rolling volatility and correlation.
| Asset | Return | Volatility | Sharpe | Max drawdown |
|---|---|---|---|---|
| Bitcoin | 94.5% | 67.6% | 1.37 | −83.0% |
| Ethereum | 164.9% | 93.8% | 1.74 | −93.5% |
| Tech (QQQ) | 25.0% | 22.8% | 1.01 | −35.1% |
| Gold | 16.4% | 16.7% | 0.86 | −23.1% |
| S&P 500 | 15.4% | 18.4% | 0.73 | −33.9% |
| Long bonds | 0.4% | 15.0% | −0.11 | −48.4% |
Result. Not yet. Bitcoin went from 7.6× as volatile as the S&P 500 in 2017–19 to 3.7× in 2024–26, so it is calming down. But its correlation with shares rose from 0.00 to 0.38 while staying near zero with gold. Crypto has paid well for its risk, but it behaves less like digital gold and more like leveraged tech, and offers little shelter when shares fall.