The brief
Adventure Works Cycles is a multinational maker of bicycles, components and accessories selling across North America, Europe and Asia. The task was to evaluate product performance and market response to support portfolio decisions, using transactional sales data from 2011 to 2014, through four questions:
- How have sales, profit and profit margin changed across product categories?
- Which subcategories consistently generated high sales volume but low margins?
- In which territories did those low-margin subcategories underperform most, and did that change over time?
- Which categories showed the strongest improvement or decline in profitability?
Building the warehouse
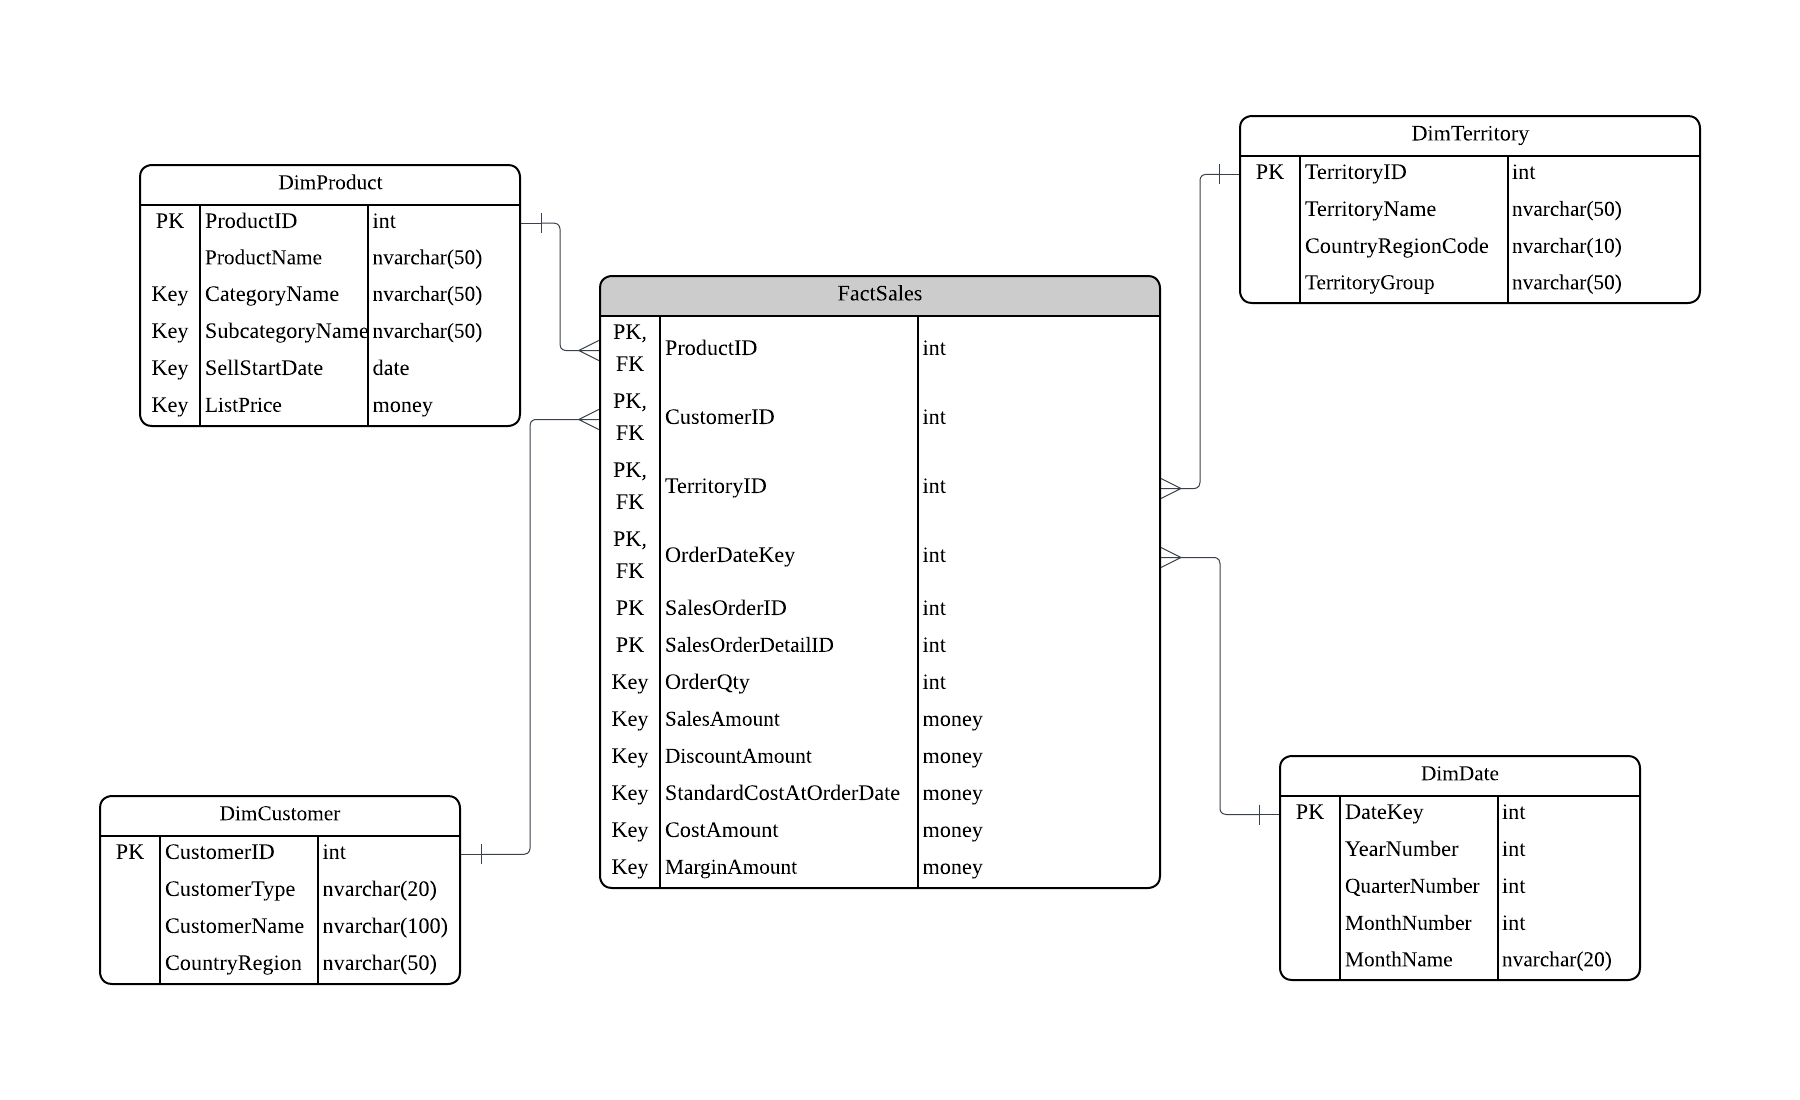
- Star schema. A FactSales table at order-line grain, holding quantity, sales, discount, cost and margin, linked to four dimensions: product (category → subcategory → product), customer, territory and date.
- Staging. Seven raw Adventure Works tables were loaded into SQLite staging tables unchanged, so transformations never touched the source data.
- Transformation. Each dimension was built from staging with duplicates removed and naming standardised, then the fact table was assembled from order headers and details.
- Validation. Checks on primary-key uniqueness, foreign-key integrity, duplicates and missing values before any analysis ran.
1. How did each category perform?
Annual sales, profit and margin by category. Scale and value turned out to be different things: Bikes sold the most but had the least stable margin.
| Category | 2011 margin | 2014 margin | Change |
|---|---|---|---|
| Accessories | 35.14% | 55.67% | +20.53 pts |
| Clothing | −26.54% | 20.22% | +46.76 pts |
| Components | −0.14% | 6.54% | +6.68 pts |
| Bikes | 13.65% | 17.05% | +3.40 pts |
Bikes fell to 2.57% in 2012 before recovering. Accessories was the strongest and most reliable contributor; Clothing had the largest turnaround.
2. Where is demand not turning into profit?
Each subcategory was compared with that year's average. It was flagged when units sold were above average and margin below average, and counted as consistent only if that happened in at least three of the four years, to filter out one-off bad years.
| Subcategory | Avg units / year | Avg margin |
|---|---|---|
| Road Bikes | 11,799 | 8.93% |
| Mountain Bikes | 7,080 | 14.65% |
| Jerseys | 5,678 | −24.26% |
The weakness is structural, not temporary. Road and Mountain Bikes are commercially important but margin-weak; Jerseys sell steadily at a loss.
3. Which territories drag margins down?
The flagged subcategories were carried forward and ranked by margin in each territory each year. The pattern held for the whole period: Northeast ranked worst every year, followed by Central and Southeast. Northeast stayed negative throughout (−5.67% in 2011, −7.42% in 2012, −3.80% in 2014), and Central and Southeast were below zero from 2012 on. The problem is concentrated in the same markets, not spread across the business.
What it means for the business
Prioritise high-margin categories such as Accessories; review Road Bikes, Mountain Bikes and Jerseys for repricing, redesign or cost control; and target Northeast, Central and Southeast for region-specific review of pricing, discounting and channel mix.
My role
This was a group project for BUSINFO 702 at the University of Auckland.